Randomness
Since we are trying to build a fake log generator to simulate a real cluster, we are eager to add as much randomness as possible to the generated logs, to make it look more similar to real ones.
For the contents of logs, we wish to make them more diverse, this can be done by throwing many possible values into configuration files then randomly pick one when needed.
Basic Randomness
Use Python module random to implement basic randomness:
import random
Random Generation
For the client's IP address, to be simple, just randomly generate 4 integers in the range of (0, 255) and concatenate them:
ip = '.'.join(str(random.randint(0, 255)) for i in range(4))
Random Selection
For log fields that need to select content every time from the pre-filled configuration files, just do it randomly:
user_id = self.user_ids[random.randint(0,len(self.user_ids)-1)]
With Distributions
Now we are able to fill in fields randomly. However, to make them more realistic, we also want to fill in random values with some given distributions.
For example, for some clusters, there will be way more GET requests than other kind of requests. To achieve this, we will make use of Python numpy module.
Numpy Module
Numpy is very useful for scientific computing, first import it:
import numpy
If you haven't installed numpy, check the Numpy official document.
To control the distribution, make use of numpy.random.choice(a, size=None, replace=True, p=None), to give GET a higher probability:
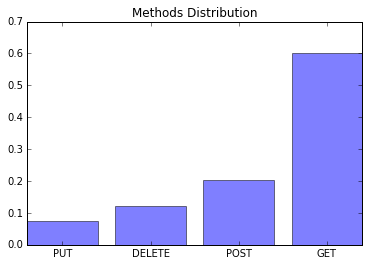
method = numpy.random.choice(self.methods, p=[0.6, 0.2, 0.1, 0.1])
This gives GET the probability of 0.6, POST 0.2, PUT0.1 and DELETE 0.1.
Check the Distributions
It's relative hard to notice the distributions in our created logs. To show their existing, let's write some code.
Created a Jupiter Notebook under $Visor_Home/test/ called fake_log_gen_dist.ipynb.
Generate some access log lines for checking, store log files into $Visor_Home/test/fake_access_log_dist.log.
In the Notebook, read in the generated log lines:
with open("fake_access_log_dist.log") as logfile:
    lines = logfile.readlines()
Then pick out the desired fields, clean them and store them in a directory:
methods = {}

for line in lines:
    method = line.split()[5]
    method = method.strip("'")
    method = method.strip('"')
    if method not in methods:
        methods[method] = 1
    else:
        methods[method] += 1

print(methods)
{'PUT': 9, 'DELETE': 15, 'POST': 25, 'GET': 74}
Then, calculate the distribution and use matplotlib module to get the bar chart: